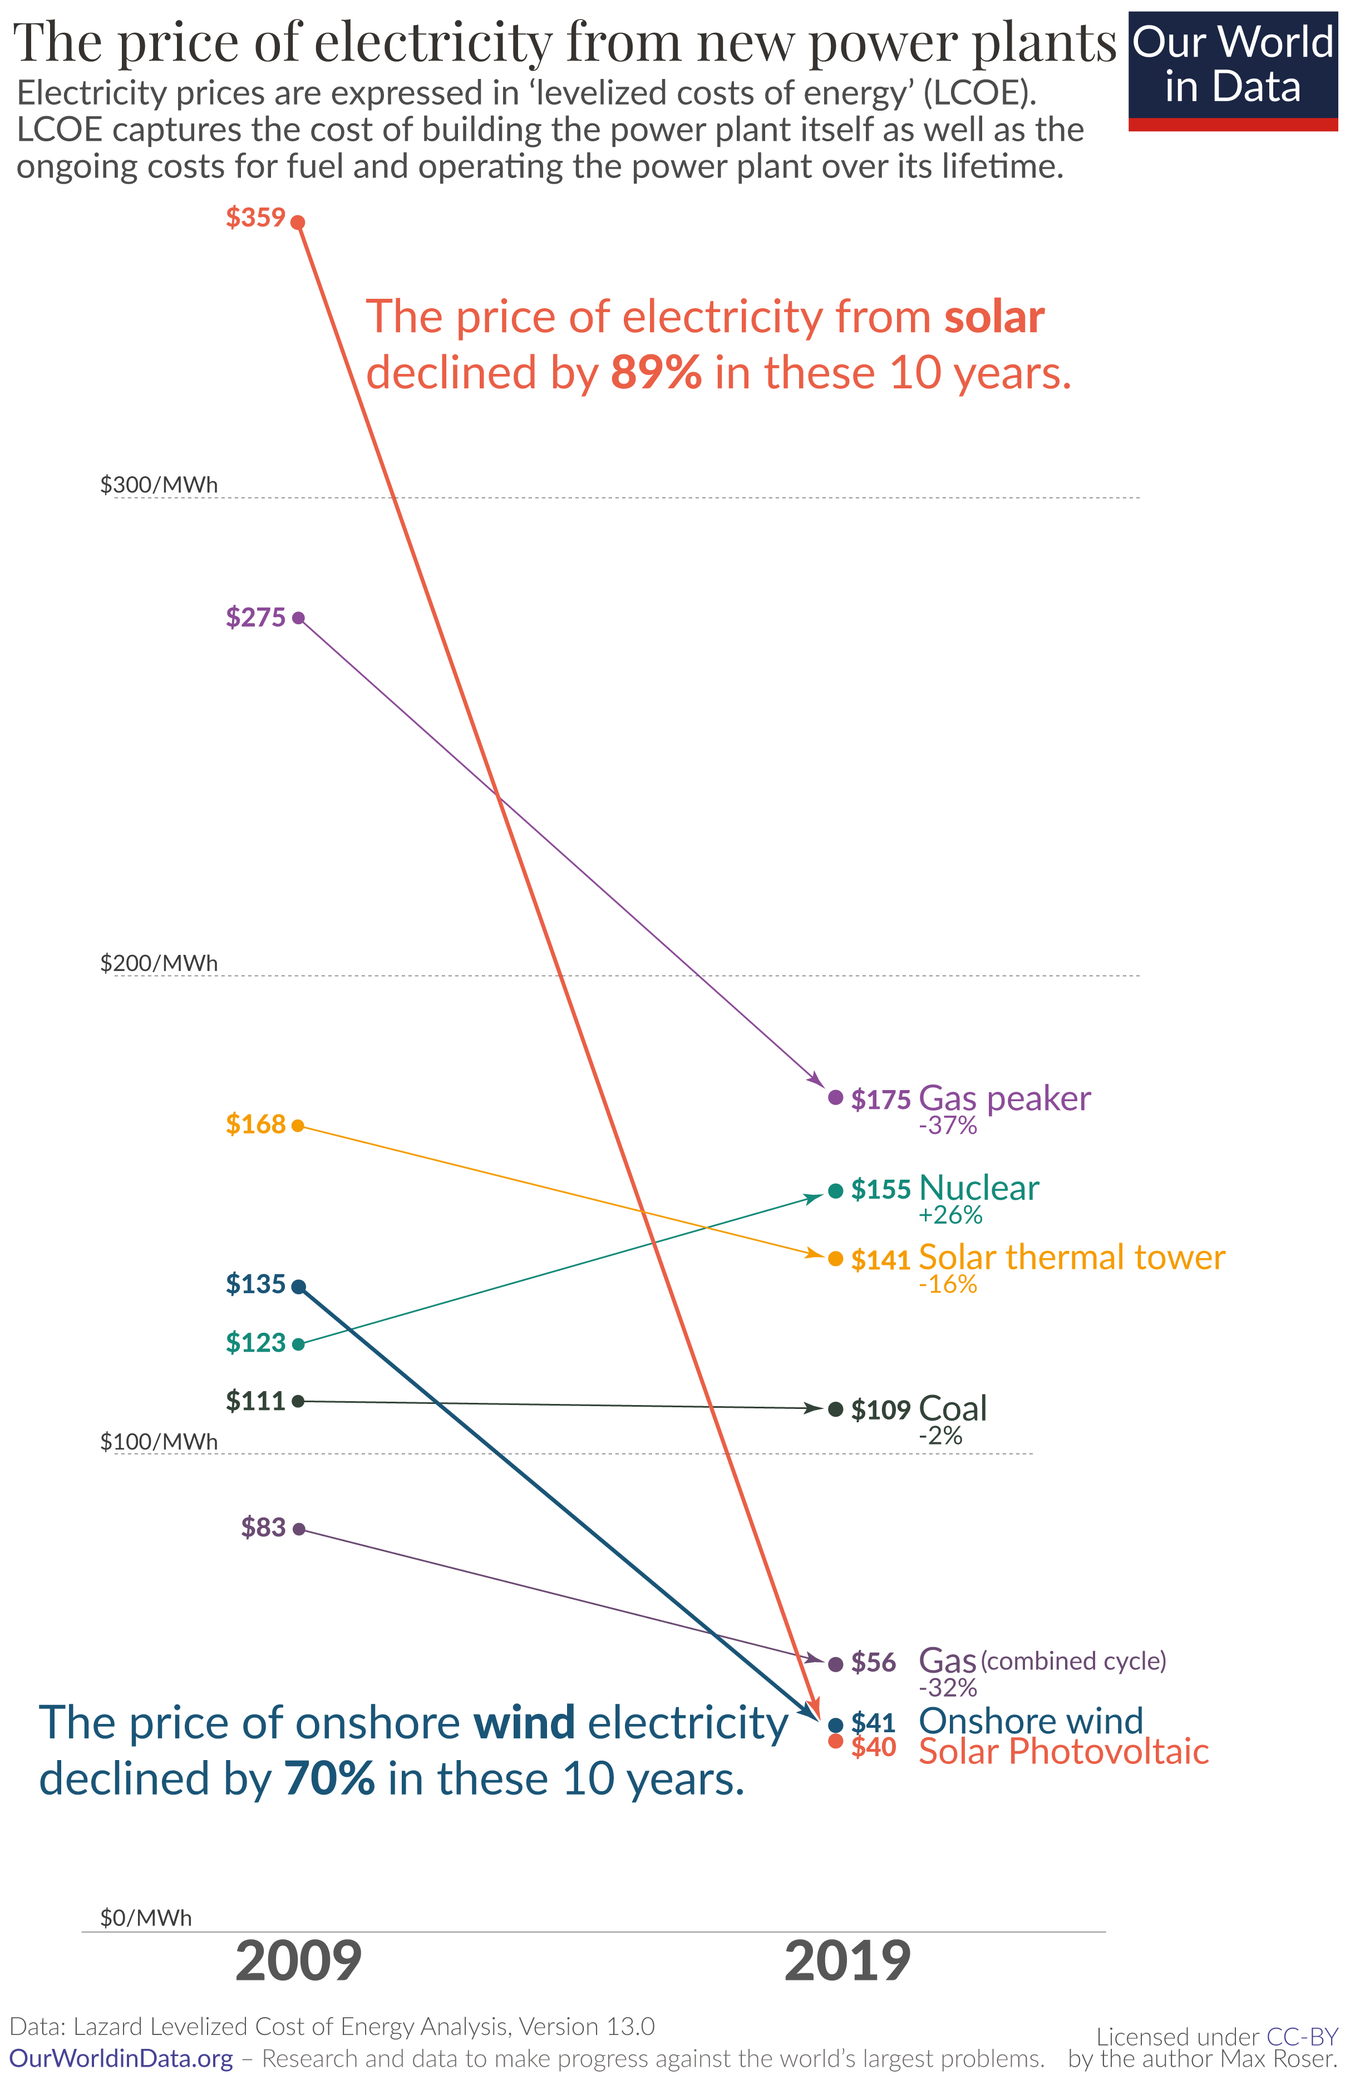
Solar now being the cheapest energy source made its rounds on Lemmy some weeks ago, if I remember correctly. I just found this graphic and felt it was worth sharing independently.
nonsense regulation combined with some high profile failures from barely modified gen 2 designs being built in countries where there hasn’t been a nuclear construction industry for decades so they have to build the infrastructure from scratch each time. it’s the wrong approach. the SMR route way is better.
“On a levelized (i.e. lifetime) basis, nuclear power is an economic source of electricity generation, combining the advantages of security, reliability and very low greenhouse gas emissions. Existing plants function well with a high degree of predictability. The operating cost of these plants is lower than almost all fossil fuel competitors, with a very low risk of operating cost inflation. Plants are now expected to operate for 60 years and even longer in the future…”
“World Nuclear Association published Nuclear Power Economics and Project Structuring in early 2017. The report notes that the economics of new nuclear plants are heavily influenced by their capital cost, which accounts for at least 60% of their LCOE. Interest charges and the construction period are important variables for determining the overall cost of capital. The escalation of nuclear capital costs in some countries, more apparent than real given the paucity of new reactor construction in OECD countries and the introduction of new designs, has peaked in the opinion of the International Energy Agency (IEA). In countries where continuous development programmes have been maintained, capital costs have been contained and, in the case of South Korea, even reduced. Over the last 15 years global median construction periods have fallen. Once a nuclear plant has been constructed, the production cost of electricity is low and predictably stable.”
TLDR: If you weren’t already on the nuke train when it was going, the upfront costs are too much to make it worth it this late in the game. You are better off just getting solar/wind + battery. If you already invested in nuke, then you are good to keep updating them.
Government subsidies work for getting new technologies out of the prototype stage and into practical deployment. Solar and wind are both good demonstrations.
Is it a fair comparison vs conventional fuel-based power (coal/nuclear)?
Ie: if you wanted to build a plant capable of producing continuously, 24 hours a day, you would need some multiple of solar panels to produce an excess during daylight, and storage.
Not that drastic drops in solar costs aren’t bad, just what would the cost-per-watt be if you had to power an average city on just solar for a year?
Look at the subtitle on the chart, it’s levelized cost over the generator’s lifetime. So not including storage for any intermittent source like solar or wind
And not including the financing cost of buying up an this upfront.
I’m buying 36kWh solar array and it will be home made diy, used.parts and maximum jank and don’t paid upfront because that’s the only way it makes economic sense and that’s hoping it works for more than 7 years (break even point at my insolation level and and grid price (8.8$cad/kWh) and it only works with net metering)
The installation just keeps getting higher. Now to add onto mine I need a load of additional equipment that was not required when my first lot of enphase inverters was installed. Also what was quoted for the labour and materials that are not the panels and inverters has almost tripled in 4 years. Have to get the roof sorted before I go ahead with it and the higher output panels and inverters mean that I would get about another 1.5kw in the same space compared to my first installation.
Where I am, a normal 6.6kw system (panels + inverter + installation) can cost as low as about $1,950usd nothing more to pay. Good for 25 years. (Higher end panels and such can go up to about $4500usd for a 6.6-7kw system)
Rooftop solar is the most expensive way to do it. The graph above is for utility scale systems. Roofs are always custom jobs and they’re priced accordingly. Utility scale uses racks that are all the same for an entire field.
If rooftop was priced alone on the chart in OP, it’s be around the price of nuclear.
Further lowering panel cost isn’t going to significantly cut that price. Cost of labor is the major part of that.
People always focus on rooftop solar, but it’s horribly expensive compared to a field of panels. The economics of scale will almost certainly keep it that way.
What we should be looking at is community solar, where neighborhoods invest in a solar field together.
I’ve always thought that in the neighborhoods where everyone lives in townhomes and mini apartments a shared multi floor parkade with solar and maybe also wind on top should be a thing. Even if the solar is just covering the parkade’s power usage.
I guess maybe not if we are talking tall building, where the roof surface area may not be sufficient for the entire building. But it would be a waste not to make use of all the unused rooftops
We had a solar salesman come by once and told us he could lower our electricity bill the same amount as it would cost us to install the solar panels.
I knew there was something up with this but I decided to let him continue to talk anyways. He does this whole presentation with solar panels and how great they are for a good 30 minutes.
Finally we get to the money part and he keeps emphasizing that they will lower my electricity bill so the cost of them will be made up there. I push him for the total cost of them plus installation and I about died.
$30,000??? They literally wanted me to pay for these for 30 years. As long as my mortgage! Aaaaah!!!
That’s about 10 times the price it costs to have a full system installed in other parts of the USA.
I put in a small solar backup power system myself for $1500. It’s not enough to power HVAC or any big appliances but it is enough that I can have my fridge, freezer, TV, and Internet going off the grid whenever there’s a power outage.
But they will still have to make the monthly payments for the solar panels. So, their real savings will only start after they paid off the loan in 30 years. lol
I had a few come over and I was already in the market for solar so I entertained them for a minute. I told them “OK, give me some invoices for your other customers so I know what you charge. Black out the names, I dont care - I just want the prices of your services and materials”. These idiots would not stop calling me or coming over to my house for months. I kept telling them “Unless you give me actual, real world dollar amounts, I won’t consider it”.
Those solar sales guys are worse than used car salesmen.
Similar here, got a quote from a company that wanted $45,000 to only cut my bill in half. Said my roof having so many levels due to being a 1.5 story made it hard to install and get good coverage. Guess I get to just burn coal power then because that price is ridiculous
What surprises me, in a way, is that photovoltaics are literally 3,5 times cheaper than just mirrors reflecting light onto a tower.
It got REAL cheap.
Wish it’d go further!
I could be wrong but I don’t think there’s any evidence that the fossil fuel industry worked to suppress storage research/funding. Pretty much every IT industry has a huge interest in improving battery tech and energy storage in general, it’s just that we’ve already hit all the low hanging fruit from a chemistry standpoint
I remember hearing stories about oil companies buying up battery patents. But this may be because they want to collect the royalties, not necessarily to suppress any kind of research. But like you said, I don’t think there is any evidence… But if they were suppressing the technology, we probably would never know about it.
My dad was a VP at an oil major and has a literal story of an LNG tech being bought and shelved. Yet he’s still just like the people he complains about in that story. They’re a strange generation, these boomers.
It’s frustrating seeing a graph showing the price of electricity going down while my utility prices go up. Does this take into account infrastructure cost?
The data stops in 2019. It’s completely outdated. The world is in chaos since covid. But anti nuke propagandists don’t care much about these “details”.
Covid actually had almost no impact on the prices and they continued to level off a little lower. The surprising one is the onshore wind remaining on par with solar and continues to drop (albeit slowely).
Hi, I’m a human being, not an “anti nuke propagandist”. I just checked, if there’s newer data, and well, there is, but no one seems to have formatted that in a way yet, which you or me would be willing to digest.
Personally, my impression has been that the solar industry was one of the industries that was pretty much completely unaffected by COVID, so I felt this graph was still perfectly relevant.
But even if it were strongly affected, I do not see why our technological progress in manufacturing, that we had in 2019, should evaporate with COVID.
There is inflation and a rise in natural catastrophes, but I feel like those would affect nuclear and others roughly proportional.
Well, if you omit batteries then you are mostly true, although with covid there was a huge shortage of electronic components that would affect solar a lot, at least depending on where you live. Batteries is a big unknown now, because with all the demand for it, we simply can’t build enough batteries to feed all the grids with it.
Alright, yeah, good point with the batteries. I’m hoping the batteries in electric cars will double up as storage for the grid (already happening today), but also that there’s just enough redundancy with other renewables.
Well the electric exec’s kid needs a third Ferrari to go with the third Lamborghini they got last year! You’re not gonna be so heartless as to deprive a 32 year old child of their birthday wish are you?
OP’s data is LCOE, which takes into account much more than $/MW. Rather importantly, expected operating liftetime is a major component (and historically THE major economic downside of PV).
IIRC, LCOE is calculated for utility-scale solar, which has seen a 500% decrease according to your chart.
Finally, Neither chart specifies, but if OP’s is in constant dollars and yours isn’t that would explain a lot as well.
I for one think this is much better than using a bar chart for this use case, as the angled arrows make it immediately obvious the information that matters the most here (the rate of change) while still keeping it contextualized (by relative positions). The bar chart version of this would inevitably look more cluttered and would not be more effective in conveying the incredible progress in solar costs.
You are not logged in. However you can subscribe from another Fediverse account, for example Lemmy or Mastodon. To do this, paste the following into the search field of your instance: [email protected]
This is the official technology community of Lemmy.ml for all news related to creation and use of technology, and to facilitate civil, meaningful discussion around it.
Ask in DM before posting product reviews or ads. All such posts otherwise are subject to removal.
Rules:
1: All Lemmy rules apply
2: Do not post low effort posts
3: NEVER post naziped*gore stuff
4: Always post article URLs or their archived version URLs as sources, NOT screenshots. Help the blind users.
5: personal rants of Big Tech CEOs like Elon Musk are unwelcome (does not include posts about their companies affecting wide range of people)
6: no advertisement posts unless verified as legitimate and non-exploitative/non-consumerist
7: crypto related posts, unless essential, are disallowed


What happened to Nuclear option?
Costs are increasing.
Why?
nonsense regulation combined with some high profile failures from barely modified gen 2 designs being built in countries where there hasn’t been a nuclear construction industry for decades so they have to build the infrastructure from scratch each time. it’s the wrong approach. the SMR route way is better.
Huge up front costs.
https://world-nuclear.org/information-library/economic-aspects/economics-of-nuclear-power.aspx
“On a levelized (i.e. lifetime) basis, nuclear power is an economic source of electricity generation, combining the advantages of security, reliability and very low greenhouse gas emissions. Existing plants function well with a high degree of predictability. The operating cost of these plants is lower than almost all fossil fuel competitors, with a very low risk of operating cost inflation. Plants are now expected to operate for 60 years and even longer in the future…”
“World Nuclear Association published Nuclear Power Economics and Project Structuring in early 2017. The report notes that the economics of new nuclear plants are heavily influenced by their capital cost, which accounts for at least 60% of their LCOE. Interest charges and the construction period are important variables for determining the overall cost of capital. The escalation of nuclear capital costs in some countries, more apparent than real given the paucity of new reactor construction in OECD countries and the introduction of new designs, has peaked in the opinion of the International Energy Agency (IEA). In countries where continuous development programmes have been maintained, capital costs have been contained and, in the case of South Korea, even reduced. Over the last 15 years global median construction periods have fallen. Once a nuclear plant has been constructed, the production cost of electricity is low and predictably stable.”
TLDR: If you weren’t already on the nuke train when it was going, the upfront costs are too much to make it worth it this late in the game. You are better off just getting solar/wind + battery. If you already invested in nuke, then you are good to keep updating them.
The Cold War is over, man.
This guy gets it.
snuffed out by big oil who co-opted anti nuclear weapons protestors to take out their competition
Data stops in 2019. It’s completely outdated. Good try.
https://www.powerengineeringint.com/renewables/lcoe-for-offshore-wind-now-on-par-with-coal-bnef/amp/
removed by mod
As far offgrid as fiber will go!
Government subsidies work for getting new technologies out of the prototype stage and into practical deployment. Solar and wind are both good demonstrations.
Is this just the cost per raw Watt produced?
Is it a fair comparison vs conventional fuel-based power (coal/nuclear)?
Ie: if you wanted to build a plant capable of producing continuously, 24 hours a day, you would need some multiple of solar panels to produce an excess during daylight, and storage.
Not that drastic drops in solar costs aren’t bad, just what would the cost-per-watt be if you had to power an average city on just solar for a year?
Well you’ll never get a “fair” comparison, because the environmental effects are never properly priced into the consumer price.
Look at the subtitle on the chart, it’s levelized cost over the generator’s lifetime. So not including storage for any intermittent source like solar or wind
And not including the financing cost of buying up an this upfront.
I’m buying 36kWh solar array and it will be home made diy, used.parts and maximum jank and don’t paid upfront because that’s the only way it makes economic sense and that’s hoping it works for more than 7 years (break even point at my insolation level and and grid price (8.8$cad/kWh) and it only works with net metering)
Levelized cost averages the fixed costs over the lifetime of the generation
They’re generally comparing utility scale installations, not home rooftop solar though.
In my area, you don’t get any government incentives unless it is professionally installed. They get you coming and going.
Yes, I never even considered the subsidies, I know it’s not for me.
Anybody can claim the tax credit though. When you file the taxes it’s a box you enter a number into.
They don’t ask for proof, but you’d better keep your receipts just in case.
Hmmmm, interesting. Thanks.
The installation just keeps getting higher. Now to add onto mine I need a load of additional equipment that was not required when my first lot of enphase inverters was installed. Also what was quoted for the labour and materials that are not the panels and inverters has almost tripled in 4 years. Have to get the roof sorted before I go ahead with it and the higher output panels and inverters mean that I would get about another 1.5kw in the same space compared to my first installation.
Really depends on where you are, sadly.
Where I am, a normal 6.6kw system (panels + inverter + installation) can cost as low as about $1,950usd nothing more to pay. Good for 25 years. (Higher end panels and such can go up to about $4500usd for a 6.6-7kw system)
Damn it’s like 9k to 10k cad where I live.
Yikes, yeah, that sounds sadly normal for a lot of places.
Rooftop solar is the most expensive way to do it. The graph above is for utility scale systems. Roofs are always custom jobs and they’re priced accordingly. Utility scale uses racks that are all the same for an entire field.
If rooftop was priced alone on the chart in OP, it’s be around the price of nuclear.
To ballpark some numbers on the contractor side, I charge about $100/hr to install it now - 4 years ago that might have been $60/hr.
Sweet, now get the panels and installation cheaper so I can afford to put it on my house
Further lowering panel cost isn’t going to significantly cut that price. Cost of labor is the major part of that.
People always focus on rooftop solar, but it’s horribly expensive compared to a field of panels. The economics of scale will almost certainly keep it that way.
What we should be looking at is community solar, where neighborhoods invest in a solar field together.
I’ve always thought that in the neighborhoods where everyone lives in townhomes and mini apartments a shared multi floor parkade with solar and maybe also wind on top should be a thing. Even if the solar is just covering the parkade’s power usage.
Wouldn’t that be a less sustainable use of land?
I guess maybe not if we are talking tall building, where the roof surface area may not be sufficient for the entire building. But it would be a waste not to make use of all the unused rooftops
Yeah, in some countries, land is at a premium. No way would it be wasted on just solar panels. Rooftop installations make the most sense.
They are even testing putting them afloat on dam reservoirs.
We had a solar salesman come by once and told us he could lower our electricity bill the same amount as it would cost us to install the solar panels.
I knew there was something up with this but I decided to let him continue to talk anyways. He does this whole presentation with solar panels and how great they are for a good 30 minutes.
Finally we get to the money part and he keeps emphasizing that they will lower my electricity bill so the cost of them will be made up there. I push him for the total cost of them plus installation and I about died.
$30,000??? They literally wanted me to pay for these for 30 years. As long as my mortgage! Aaaaah!!!
That’s about 10 times the price it costs to have a full system installed in other parts of the USA.
I put in a small solar backup power system myself for $1500. It’s not enough to power HVAC or any big appliances but it is enough that I can have my fridge, freezer, TV, and Internet going off the grid whenever there’s a power outage.
Some companies in my area are installing them for free, and taking the utility difference. It’s a novel approach.
I want a discount on my electricity if I have to have a solar array on my land. Even if it were otherwise free.
Just to save $100 a month.
100x12x30
If I save 100$ a month, sign me up
But they will still have to make the monthly payments for the solar panels. So, their real savings will only start after they paid off the loan in 30 years. lol
I had a few come over and I was already in the market for solar so I entertained them for a minute. I told them “OK, give me some invoices for your other customers so I know what you charge. Black out the names, I dont care - I just want the prices of your services and materials”. These idiots would not stop calling me or coming over to my house for months. I kept telling them “Unless you give me actual, real world dollar amounts, I won’t consider it”.
Those solar sales guys are worse than used car salesmen.
Similar here, got a quote from a company that wanted $45,000 to only cut my bill in half. Said my roof having so many levels due to being a 1.5 story made it hard to install and get good coverage. Guess I get to just burn coal power then because that price is ridiculous
What surprises me, in a way, is that photovoltaics are literally 3,5 times cheaper than just mirrors reflecting light onto a tower. It got REAL cheap. Wish it’d go further!
The mirrors are the not the expensive part.
What is? Thermal to electricity conversion?
Yup. Steam turbine generators have a lot of moving parts, and moving parts break
Got it, thanks
Imagine how steep that line would be if the fossil fuel lobbies hadn’t been fighting it tooth and nail all these years
It would be less steep because solar costs would have come down earlier.
That would make it steeper, no?
This part of the graph (2009-2019) would be less steep, because this sharp drop would have happened earlier - we’d be further along the curve
much more important: we’d be years ahead with storage technology.
I could be wrong but I don’t think there’s any evidence that the fossil fuel industry worked to suppress storage research/funding. Pretty much every IT industry has a huge interest in improving battery tech and energy storage in general, it’s just that we’ve already hit all the low hanging fruit from a chemistry standpoint
I remember hearing stories about oil companies buying up battery patents. But this may be because they want to collect the royalties, not necessarily to suppress any kind of research. But like you said, I don’t think there is any evidence… But if they were suppressing the technology, we probably would never know about it.
My dad was a VP at an oil major and has a literal story of an LNG tech being bought and shelved. Yet he’s still just like the people he complains about in that story. They’re a strange generation, these boomers.
Gotta keep prices high yo
I wish hydroelectricity was there.
Thanks, China.
And Germany!
It’s frustrating seeing a graph showing the price of electricity going down while my utility prices go up. Does this take into account infrastructure cost?
Yeah energy prices have gone through the roof but apparently it’s cheaper in every way except nuclear - and we don’t even have nuclear around here
The data stops in 2019. It’s completely outdated. The world is in chaos since covid. But anti nuke propagandists don’t care much about these “details”.
https://www.powerengineeringint.com/renewables/lcoe-for-offshore-wind-now-on-par-with-coal-bnef/amp/
Covid actually had almost no impact on the prices and they continued to level off a little lower. The surprising one is the onshore wind remaining on par with solar and continues to drop (albeit slowely).
Gas skyrocketed in Europe. Oil is going yo-yo. How does this have no impact on the price?
Hi, I’m a human being, not an “anti nuke propagandist”. I just checked, if there’s newer data, and well, there is, but no one seems to have formatted that in a way yet, which you or me would be willing to digest.
Personally, my impression has been that the solar industry was one of the industries that was pretty much completely unaffected by COVID, so I felt this graph was still perfectly relevant.
But even if it were strongly affected, I do not see why our technological progress in manufacturing, that we had in 2019, should evaporate with COVID.
There is inflation and a rise in natural catastrophes, but I feel like those would affect nuclear and others roughly proportional.
Well, if you omit batteries then you are mostly true, although with covid there was a huge shortage of electronic components that would affect solar a lot, at least depending on where you live. Batteries is a big unknown now, because with all the demand for it, we simply can’t build enough batteries to feed all the grids with it.
Alright, yeah, good point with the batteries. I’m hoping the batteries in electric cars will double up as storage for the grid (already happening today), but also that there’s just enough redundancy with other renewables.
deleted by creator
my bill has gone up 89%
Well the electric exec’s kid needs a third Ferrari to go with the third Lamborghini they got last year! You’re not gonna be so heartless as to deprive a 32 year old child of their birthday wish are you?
Gas peaker? I hardly know her!
Without saying anything about politics, environment, or source:
Why, for the love of Satan, does this graph have only 2 data points per source?
Why use a line chart 📉 for that?
This is clear bar chart territory 📊.
The cost of the panels themselves doesn’t seem to have gone down nearly that much.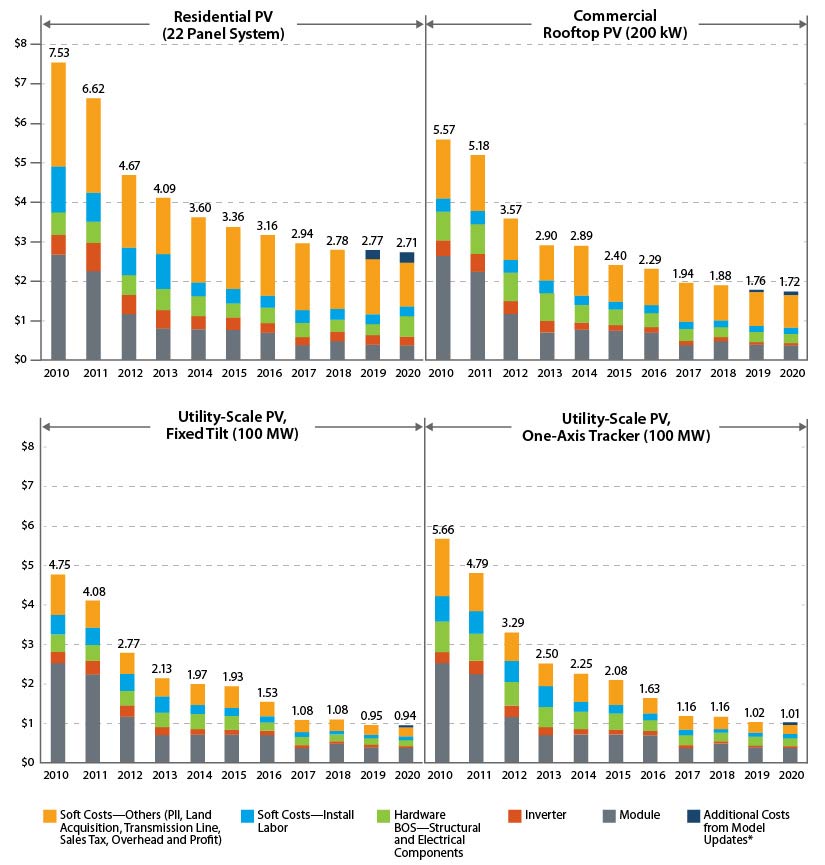
OP’s data is LCOE, which takes into account much more than $/MW. Rather importantly, expected operating liftetime is a major component (and historically THE major economic downside of PV).
IIRC, LCOE is calculated for utility-scale solar, which has seen a 500% decrease according to your chart.
Finally, Neither chart specifies, but if OP’s is in constant dollars and yours isn’t that would explain a lot as well.
deleted by creator
It’s called a slope chart and it has several benefits compared to bar charts:
I for one think this is much better than using a bar chart for this use case, as the angled arrows make it immediately obvious the information that matters the most here (the rate of change) while still keeping it contextualized (by relative positions). The bar chart version of this would inevitably look more cluttered and would not be more effective in conveying the incredible progress in solar costs.